This report summarizes information about your entire claim (including multiple provider claims) that you usually need to fill-out state claim reports. Note that claims that are on hold are not included in this report, but those providers are included in the Current Active Homes count.
In some states, Minute Menu HX has developed a custom State claim Summary that matches the format required by your state agency. In most other states, this report uses the default Minute Menu HX format. In all states, if you generate this report form the Reports menu (instead of the Submit Claim to State window), Minute Menu HX's standard State Claim Summary format is used.
Typically, you need to manually copy the numbers printed on this report to your State's specific report. However, if you are in a state where Minute Menu HX generates the State's specific report, you do not need to manually copy any part of this report.
Instead, print your state-specific version of this report from the Submit Claim to State window. Filter to All Submissions (if your State requires a re-statement of the monthly totals each time an amended claim is submitted) or filter to specific submission batches (if your State only requires you to report new counts only with amended claims).
To print this report:
- Click the Reports menu, select State Claim Summary Report. The Select the Month dialog box opens.
- Click the Select Month drop-down menu and select the month for which to print the report.
- Click Continue. The Select Accounting Style dialog box opens.
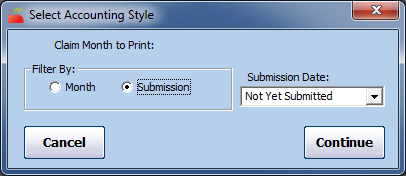
- In the Filter By section, select Month or Submission.
- Click the Submission Date box and All Submission Batches or Not Yet Submitted. Not Yet Submitted is the default.
- Click Continue. The report is generated. If you are in a state that provides supplemental reimbursement funds (in addition to federal CACFP reimbursements), this report prints with twice the number of pages. One set of pages prints the federal dollar totals, and the other prints the state dollar totals. All meal counts are the same, but the dollar amounts are different.

Note: To print the state-specific version of this report, click Claims and select Submit Claims to State. The Submit Claim to State window opens. Click Print State Summary. The report (PDF) is generated.
Fields of Note
The top portion of this report is split into three distinct sections:
- Claim Tier Breakdown
- Provider Tier Breakdown
- Claiming Home Totals
Claim Tier Breakdown
This section provides counts for current active and claiming hoes, as well as zero claiming homes, attendance, and so on.
- Current Active Homes: This is a count of homes that were active, but not necessarily claiming, for the claim month. These are broken down by estimated claiming Tier. This is estimated because non-claiming providers are included in this count. Use these numbers if your state requires counts of active homes by claim Tier. Otherwise, use the number of active homes in the Provider Tier section. Many states do not require you to report this number at all. Instead, they require the claiming/participating home count. See Homes Claiming, below.
- Homes Claiming: This is the total number of homes that claimed (participated) in the selected claim month. This is split by claim Tier, not provider Tier. It includes all new homes claiming, but does not include double counts for any homes that claimed and then were adjusted.
- Zero-$$ Claiming Homes: If a provider has submitted a claim and no meals can be reimbursed, a claim still exists in Minute Menu HX, but it is for zero dollars. These providers are included in the Homes Claiming counts, but they should not be counted when reporting to the State, as your agency is not eligible for administrative funds for these providers. Subtract these numbers from the Homes Claiming counts when reporting claiming home counts to the State.
- Participated: This is the total number of unique children claimed, split by claim Tier. Mixed Tier claims are further split so you have the totals for Tier 1 and Tier 2 children claimed in such homes. This count is always lower than child enrollment figures, unless you don't maintain accurate enrollment records and have overwritten edit checks performed when saving manual claims. If your State requires a count of enrolled participating that is categorized by Tier 1, Tier 2 Hi, and Tier 2 Lo, you may need to add some numbers on this line.
- The Tier 1 number corresponds to the Tier 1 count on your State report.
- Add Tier 2 Hi to the Hi sub-category for Mixed Tier homes.
- Add Tier 2 Lo to the Lo sub-category for Mixed Tier homes.
- ADA: This is the Average Daily Attendance, which is the sum total of all individual claim ADAs in their respective claim Tier categories. In most states, this is rounded up to the nearest whole number—If all of your ADA totals are a whole number with a single zero after the decimal point, then the ADA is rounded to the nearest whole number on your report. In some states, the ADA includes a value after the decimal point. Mixed Tier homes are further split into Hi and Lo counts to provide an accurate appraisal of Tier 1 and tier 2 children.
Provider Tier Breakdown
This section provides values for your current active homes and enrolled children.
- Current Active Homes: This is the number of active, but not necessarily claiming, homes broken down by provider Tier (not claiming Tier).
- Children Enrolled: This is the total number of children who were enrolled, but not necessarily claimed, in that month. This is broken down by Tier. Most states require a count of the number of claimed children, rather than the number of enrolled children. If that's the case, reference the Participated figures in the Claim Tier Breakdown section (above).
Claiming Home Totals
This section provides totals for attendance, new homes claiming, zero-dollar claims, and so on.
- Total Attendance/Maximum Days Claimed: Use this number if your state requires a modified definition of the ADA, which looks at Total Attendance divided by the maximum number of claimed days for the month.
- Claim Totals by Submission Batch: This is the submission batch for the given month. This is useful if you only need to report new information to your State for each amended submission, because you must report the correct number of claiming homes that are newly claiming with the amended claim.
- New Homes Claiming: This is the number of new homes claiming with the listed batch.
- Zero $ Claims: This is the number of claims in the batch that were for $0.00 total. You should generally factor these numbers out of the report you send to the State. Be careful if any zero-dollar claiming homes appear on your reports. Claiming one of these homes for reimbursement from the State could result in an audit finding, so it is best to identify these homes and either delete those claims completely, or fix the data situation that caused them to be zeroed-out and re-process them.